
The Two Things You Need for Climbing Harder
Note: The heat maps in this post will be regularly updated based on our current dataset. Most recent update: October 2022.
Climbing is complex. Training for climbing even more so. As a result, it’s tough to know where to start and what your energy should be directed toward. We’ve been collecting strength data from climbers for a few years now, in hopes that we can help shed a little light on exactly that predicament. We think we have the answer. Or at least AN answer.
Based on what we’ve seen in our data, Max Hang and Max Weighted Pull-Up, when looked at in combination, are the strongest predictors of climbing performance. There may be better - just not in what we’re measuring currently. This holds true for both sport climbing and bouldering, though the model for bouldering is much more convincing. Because our data guy, Dale Wilson, understands that it takes a little nudging for us to understand complex data, he opted to show it to us using a method we hadn’t yet seen: Heat Maps. I’ll let Dale explain:
Heat maps are a way of visualizing the relationship between two variables in two dimensional space while using a third variable to act as a color scheme. Common examples of this third variable are frequency of occurrence or magnitude of a target variable. Common applications for heat maps have been gene expression tables or monthly average temperatures by year - you can see an example HERE.
In our case, our two dimensional space is made using Strength:Weight ratio for 10 second Max Hang on a 20mm edge and Str:Wt ratio for 1 rep Max Weighted Pull-Up from a bar or jugs. The third variable providing color coding is median self-reported maximum outdoor grade in the previous 12 months for that range of Str:Wt ratios. The Str:Wt ratios are grouped into bins of 1.00 to 1.10, 1.11 to 1.20, and so on.
Slick. I’m always left with tons of “what if” questions when I look at charts and graphs about climbers. While that’s still the case, the heat maps do answer a few of the questions before I even get to ask them. Are they foolproof? Of course not. Climbing is far too complicated to be entirely encapsulated by just a few easy-to-get measurements. You aren’t getting off that easy.
Let’s take a look at our heat maps, and I’ll let Dale break it down for us below:

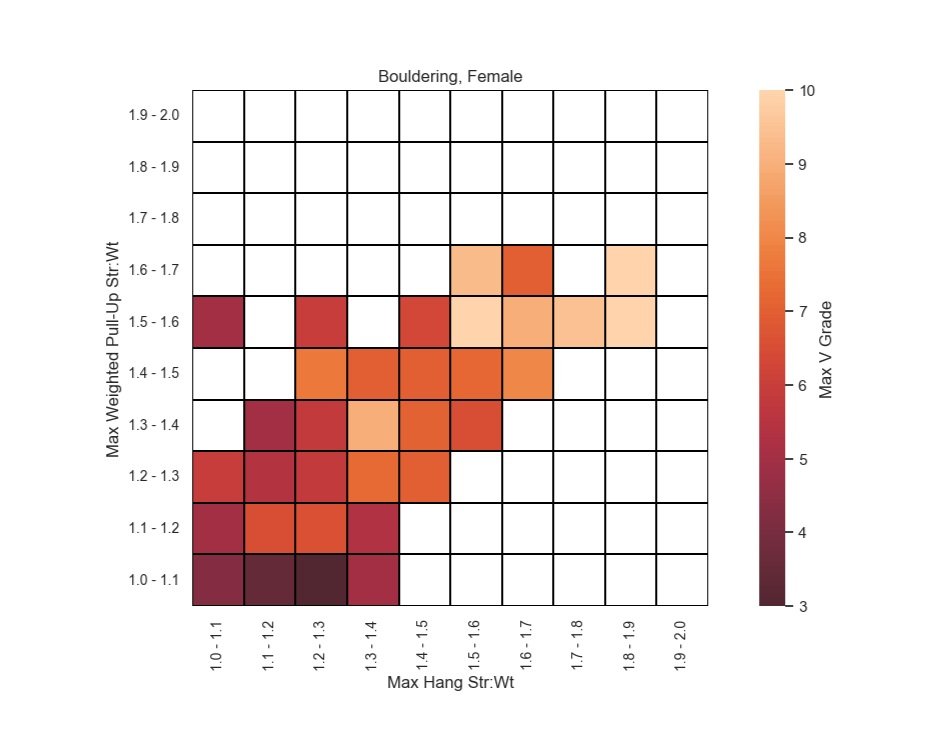
Q1, Upper Right – High pulling strength AND high finger strength.
Individuals in this area exhibit really high performance on the rock which makes perfect sense. We see plenty of people in this region climbing double digit boulders, but we also see individuals with high measurements not climbing elite grades. This can occur for all manner of reasons: from not having access to outdoor climbing, poor technical or tactical skills, or having big projects just not quite come together.
Q2, Upper Left – High pulling strength BUT lower finger strength.
We see some high performance here but it’s much more rare, and we generally don’t see many folks in this region performing beyond the V10 grade. In the context of bouldering, pulling strength is incredibly important, but that strength can only take you so far if it can’t be applied on small or poor hand holds.
Q3, Lower Left – Lower pulling strength AND lower finger strength.
In this region, individuals do not present with incredibly high numbers in either category and performance is in the easier to moderate grades. Climbs in this grade range do not frequently feature incredible spans between holds or require superhuman finger strength to confidently grab those holds if the distance between them is indeed large. As such, most climbs up to V7/8 may require only moderate levels of pulling and finger strength, but rely more heavily on movement skills, positioning in relation to holds, and efficient tactics.
Q4, Lower Right – Low pulling strength BUT high finger strength.
We see almost no instances of this in our clients. This could be due to a variety of reasons: Climbing, even at moderate grades, results in a significant volume of upper body pulling movements which, even in the absence of dedicated pulling strength work outside of the sport, can result in moderate to high pulling strength. As such, even recreational climbers can present with what the general population would consider high pulling strength. Additionally, muscle responds much more quickly to training stimulus than connective tissue.

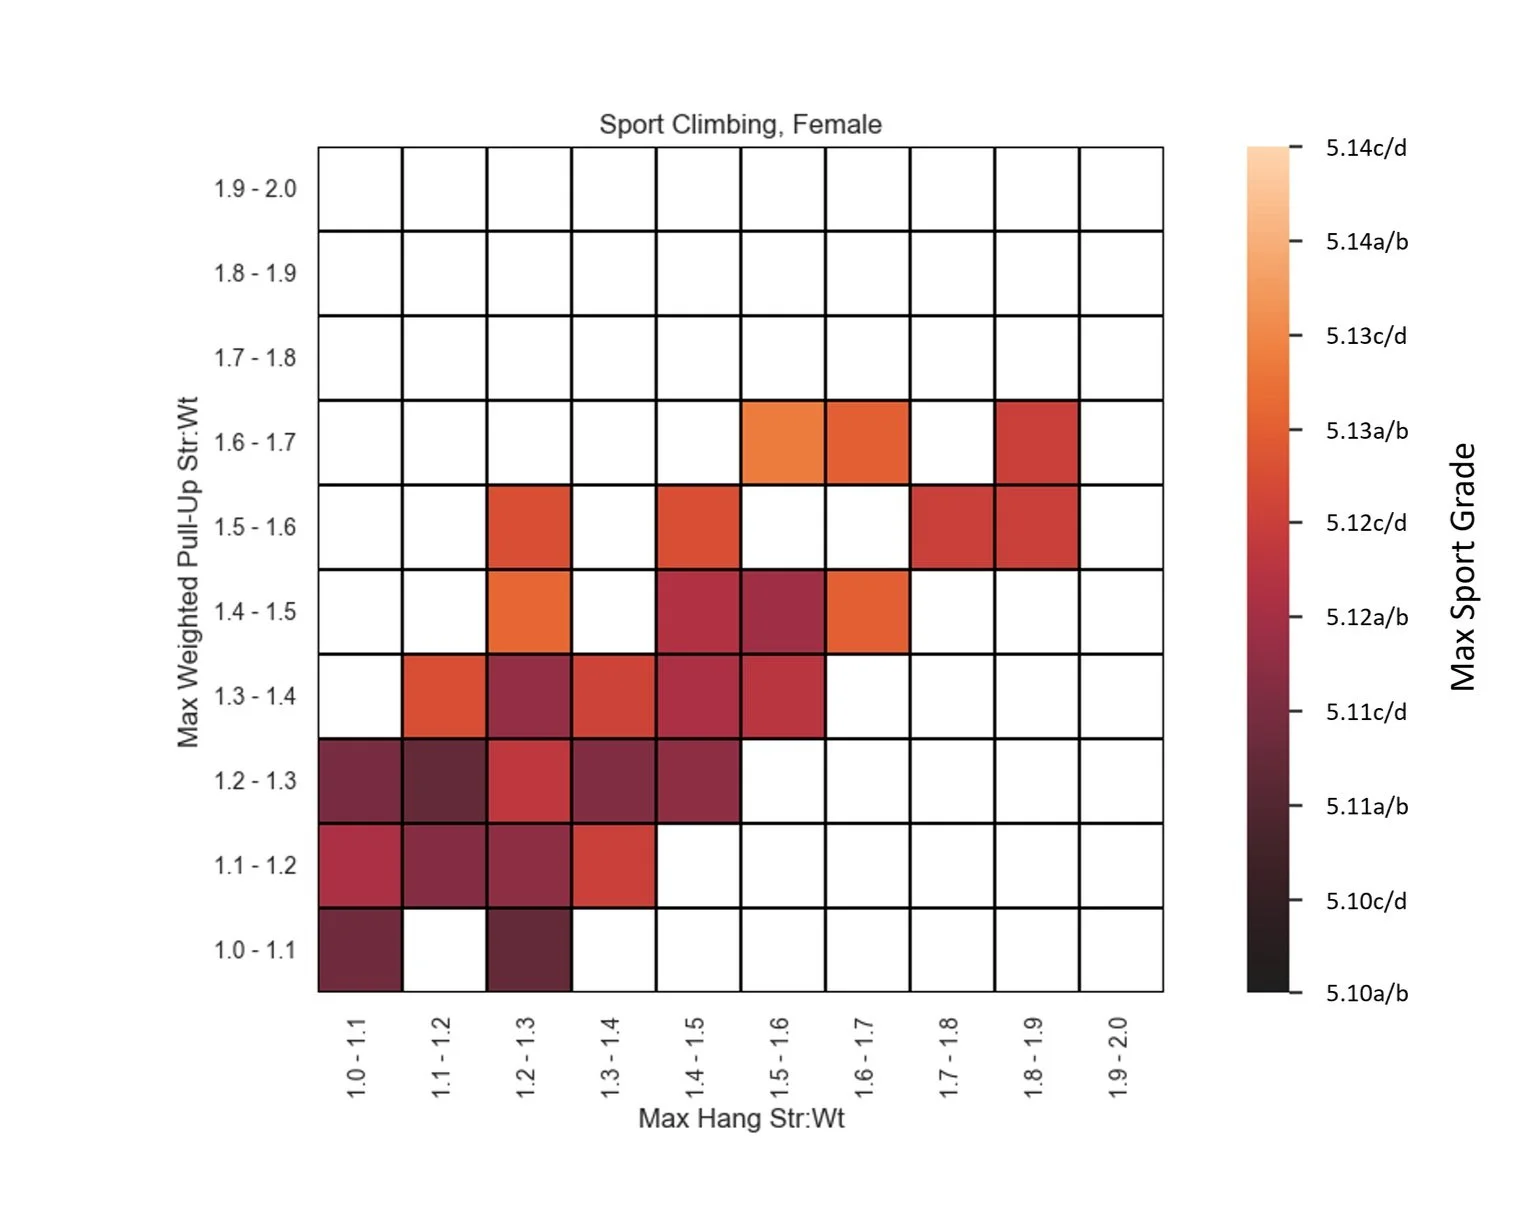
Sport climbing presents with similar trends but a few notable differences as well. We see folks from all sorts of Str:Wt ratios perform at the 5.12 and 5.13 grade ranges. This is most likely because sport climbing requires a unique set of mental and tactical skills that finger and pulling strength generally aren’t going to make up for.
Regarding sport climbing, we also aren’t measuring endurance here, and it’s absolutely possible to climb relatively difficult routes if you’re a masterful technician with good endurance. Or if you happen to climb in the Red River Gorge, just good endurance. Or in Maple Canyon, if you have good kneebar skills. But I digress…
How To Determine Where You Stand
Figuring out how you can use this data to determine how to train and focus your efforts is pretty simple. You’ll need to find the two measurements, your strength to weight ratio, and then compare against the heat maps. Videos for both measurements are included below.
Max Hang: 20mm edge, half crimp, 10 seconds.
Max Weighted Pullup: Bar or Jugs, Full Pullup 1 RM.
Once you have these measurements, finding your strength to weight ratio is just a matter of plugging the numbers into a formula:
Str:wt ratio = (Body Weight (lb) + Added Weight (lb)) / Body Weight (lb)
Now that you have your strength to weight ratio, you can see where you sit in the heat map. Do your numbers line up with the other climbers with the same approximate strength levels? If so, you are probably right on par. But what if not?
Using the box plots on THIS PAGE you can also determine what other climbers who have reached your goal grades are measuring at - and then focus your training accordingly. If one of the two measurements here seems lower than the average, it’s a safe bet that you should put some time into it. I’ll let Dale explain what he sees:
The big take-aways from this analysis are that development of high levels of pulling and finger strength should be a high priority for every climber. Dedicated work in these areas pays dividends in performance across a climbing career and is the cornerstone of much climbing training. However, development of these attributes alone doesn’t guarantee high performance and the need for developing movement skills, mental game, and sending tactics remains crucial. Climbing is an incredibly skill-dependent sport and looking for “hacks” to the next grade probably isn’t going to serve you well in the long (or even short) term.
Let’s look at a few common scenarios:
Both numbers are lower than expected: Put some time into both finger and pull strength. Our Fingers+ Proven Plan is a great place to start.
One number is way below what’s expected: Low-hanging fruit! Put some dedicated time and energy into it.
Both measurements are high, but my climbing grade is low: You don’t need to continue putting time and energy toward fingers and pulling. Put that energy toward climbing or tactics on the projects instead.
Essentially, this data just gives us a general impression of where we should start, and where our energy should be focused. There will always be innumerable caveats and considerations - so narrowing it down a little should be a good thing. Finger and pulling strength are hugely important for climbing performance - but not the only aspect worth putting energy toward. Figure out your path and commit to it.
Want help with your training?
We’ve got Proven Plans for nearly every level climber. Check them out HERE and find the one that suits you. Our new Fingers+ plan is built with this data in mind, and designed for the climber who either has limited equipment or is happy with their own climbing, but wants help with finger and pull strength.


If we want to assess our climbing movement skills over time, are the standardized boards the best option? We're conflicted…